
|
|
|
|
|
|
|
The aim of this experiment is to:
1. Get acquainted with phase
diagrams, invariant
reactions, and phase transformations.
2. Studying the effect
of the invariant reactions on microstructure.
3. Differentiating between eutectic,
hypo-eutectic, and hyper-eutectic microstructures.
The term Phase refers to a homogeneous portion of a system that has a distinguishable chemical composition and physical structure characteristics; which means the same crystal structure. An important way of representing solid solution alloys, with its two types, is the use of Phase Diagrams. Phase diagrams are graphical representation for a certain alloy at equilibrium conditions , showing the phases that exist at a certain temperature and composition of solvent and solute(s). Alloys are composed of a solvent e.g. copper, which is the base material, in which certain solute(s) e.g. Nickel is solved in, forming a certain alloy Cu-Ni (fig. 1). Such an alloy is called a binary substitutional alloy since it is composed of two materials.
The above phase diagram shows a case of total solubility between Nickel and Copper. This is manifested in the absence of two phase sections. Yet, since metals have limited solubility limits in each other depending on factors for formation of SSS (atomic radius, valence, e-negativity, crystal structure), it is expected to have certain positions in the phase diagrams in which a single phase will transform into a two-phase material at a given temperature and composition. That is why in substitutional solid solutions (SSS), the importance of phase diagrams is to the show what is called solubility limit, which means the maximum solute concentration that can be dissolved in the solute.
As the solubility decreases between the alloying elements, several phases start to appear at different compositions and temperatures, which gives a chance for the formation of phase transformation reactions. Phase transformation reactions are so-called invariant reactions, since they occur under equilibrium conditions, at a specific temperature and composition that cannot be varied (zero degrees of freedom). There are 5 types: Eutectic, Eutectoid, Monotectic, Peritectic, and Peritectoid.
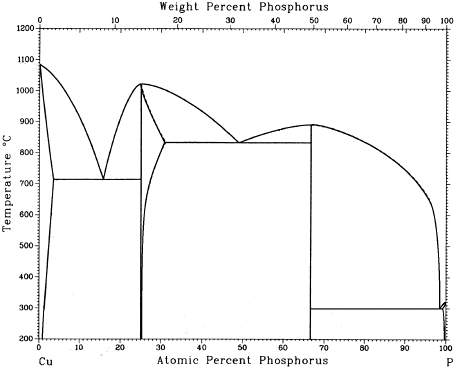
In solid solution alloys where the constituents are not totally soluble (figure(2)), the phase diagram is composed of six distinctive regions that are separated from each other by lines indicating the end of a certain phase and the beginning of another. The region a is a solid solution of (B) in (A), and since it shows a higher concentration of metal (A), it is termed a . On the other side, the region b is a solid solution of (A) in (B). In between them, there is the a + b region, which is a two-phase solid region. The solid solution regions are separated from the 2-phase region by the blue lines, which are called Solvus lines. Above that, there are two regions on each side showing a structure that is composed of a molten liquid phase plus either a or b phases. These two regions are separated from the solid 2-phase region by the Solidus green line. Whereas on the top of the drawing, there exists the liquid region which is separated from the other regions by the pink liquidus lines.

One of the important sections in figure(2) is the intersection between the solidus and liquidus lines, which is an invariant reaction that is called the Eutectic reaction. The eutectic reaction is a transformation reaction in which a single liquid phase transforms into two solid forms (solid solution of a+b) as figure (3).

The importance of the eutectic reaction is the formation of 2-phase
alloy system since the second phase can be a source of strength if its
size is fine, creating more obstacles that hinder the dislocation motion.
Equilibrium conditions means
the use of slow cooling condition
The specimen is made of an interstitial Cu-P binary alloy system. Three specimens with different phosphorus content (4.5%, 8.4%, 10.5%) were ground, polished, etched and prepared for microstructure investigations.
Specimen (1): 8.4% phosphorus content:
etch or 30 seconds in aqueous ferrous chloride.
Specimen (2): 4.5% phosphorus content:
etch or 40 seconds in aqueous ferrous chloride, which makes a dark surface
after etching.
Specimen (3): 10.5% phosphorus content:
etch for several seconds in a solution containing 2 parts of water/1 part
ammonia solution and hydrogen peroxide.
Optical Microscope
--The following sites and books contain useful information and images for several articles that we have encountered in this experiment. Make sure to check them.
Georgia Tech Phase Diagrams Page
Kalpakjian, Serope. Manufacturing Process for Engineering Materials. Addison Wesley, 3rd Ed., 1997.
Smith, William F. . Principles of Materials Science and Engineering. McGraw Hill, 3rd Ed., 1996. (p. 128-132)